Knobs and graphs
The MVP shipped, the basic flows worked, and the next thing on my mind was load testing — pointing a synthetic workload at the service and seeing where it bent. I knew that wasn’t going to tell me much unless I could see what was happening inside the service in real time and turn the knobs that were likely to matter. So before I started load testing, I built out an admin dashboard.
Three things in particular had to exist before I could start. First, I needed a lot of visibility — enough instrumentation to actually identify a bottleneck when one showed up. Second, I needed knobs I could turn at runtime, not at deploy time, so I could try a different limit and see the effect immediately. Third, I needed an easy way to reset the database, so I could run an experiment, blow it away, change a setting, and try again without worrying about leaving the system in a weird state.
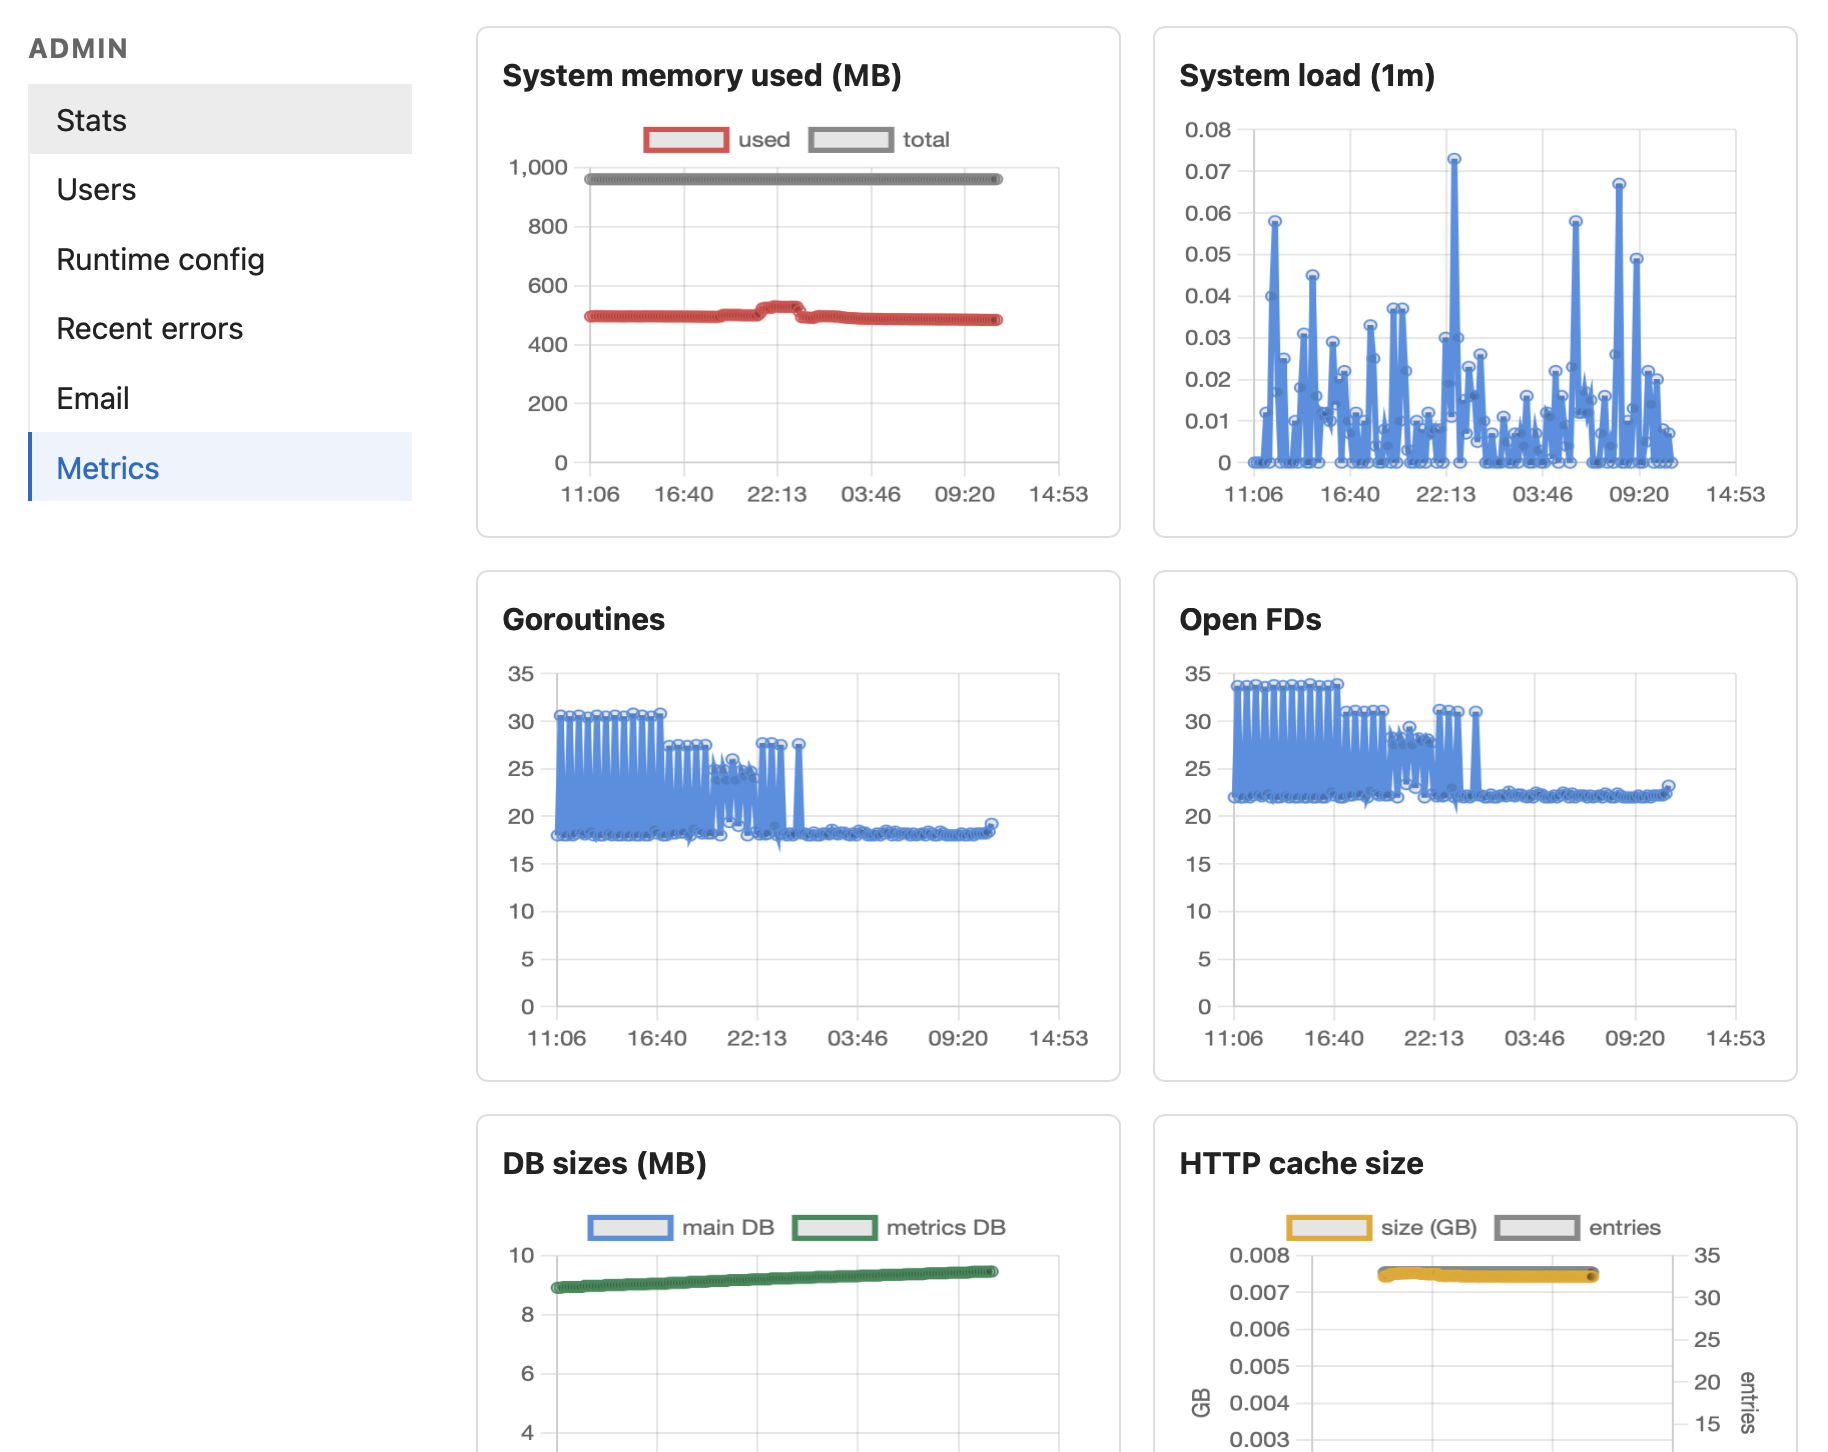
The admin sidebar today has six sections: Stats (basic counts), Users (the user list and per-user detail), Runtime config (the tunable knobs), Recent errors (the last N application errors with context), Email (the outbox dashboard), and Metrics (the graphs). Most of those existed in basic form on day two of the build. The Metrics page is where most of the load-test prep work went.
I tried to graph as many things as I could think of. Request and fetch latencies, error rates, cache hit rates, memory and load, goroutines and file descriptors, database sizes, signup and feed-churn rates — the Metrics page is, in effect, a wall of small charts. The point isn’t that any one of them is indispensable. The point is that during a load test I want to be able to glance at the screen and see immediately where the service is hurting, rather than guess. And in steady-state production, the same dashboard tells me whether the thing is healthy without me logging into a host to find out.
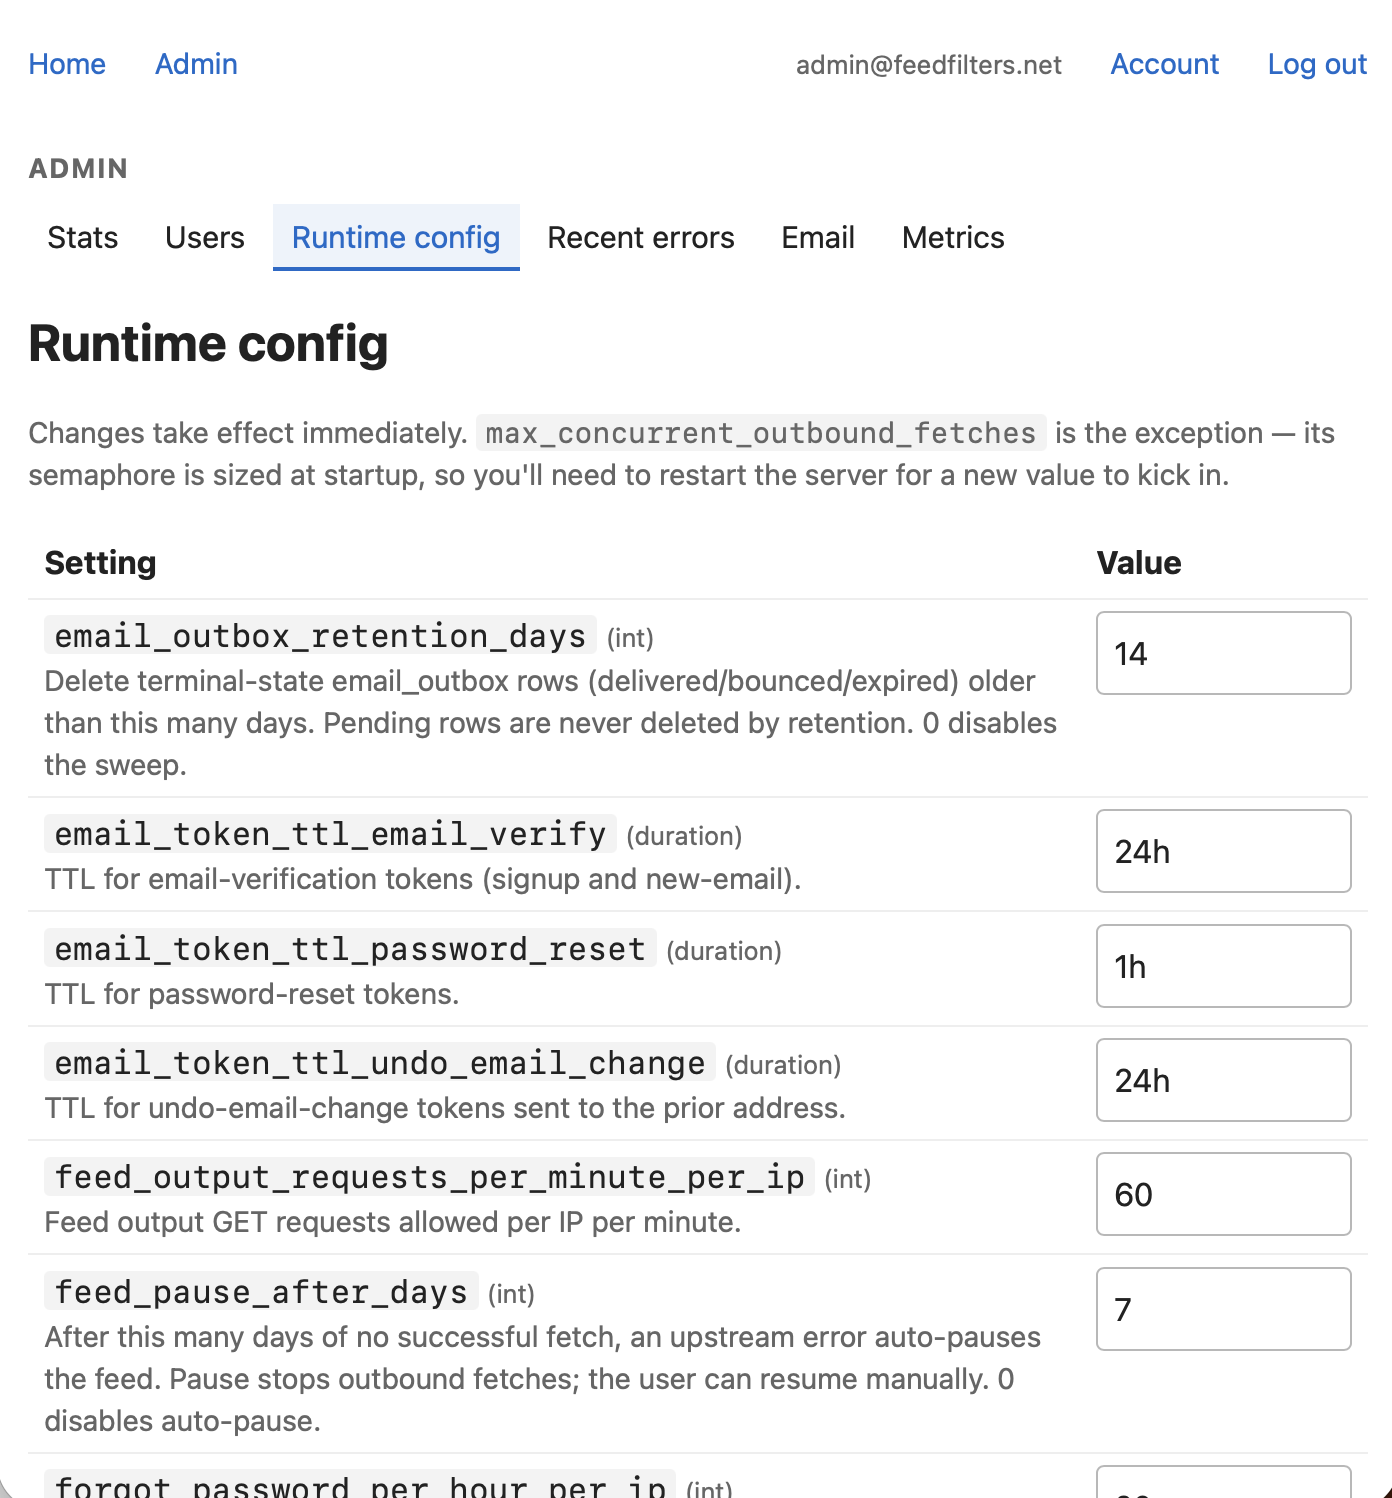
The Runtime config page is the other piece I’m pleased with. Most of the limits I’d otherwise have to redeploy to change — rate limits, connection pool sizes, fetcher concurrency, cache TTL overrides — are tunable from a form. Save the form, the change takes effect on the next sample tick (a fraction of a second later). When you’re load testing, the ability to change a limit and immediately watch the dashboard react is the difference between guessing and knowing. It also means I can do the same thing in production if I ever need to.
The database reset belongs in the same category. It’s not glamorous — a debug-mode endpoint with a confirmation prompt — but being able to wipe the slate without rebuilding the container or shelling into the host changes how willing I am to run risky experiments. That willingness is most of what makes load testing actually useful.
The graphs, the live knobs, and the easy reset are what made load testing feasible. That’s the next post.